History and diagnostics
Find out what piqueld did, when, and why something failed.
Run the piquelctl commands on this page on the host, or on any machine where
piquelctl is signed in.
See what happened
piqueld records every deployment step, configuration change, secret change and failure as an event. Secret values, environment values and webhook URLs are never part of them.
-
In the dashboard, the Events page lists every event you can read, and each environment’s Events tab lists that environment’s.
-
With
piquelctl, give an application’s ID, whichpiquelctl app showprints:$ piquelctl events --application app-01a16b1282cf755287920502b5793cd1 --limit 3 11 1792797737680 environment_created - attempt - created environment production by host operator (uid 1000) 12 1792797737682 refresh_requested operation-01a16b1282d27232a446f3dbc4a19808 attempt 0 by host operator (uid 1000) 13 1792797737713 operation_started operation-01a16b1282d27232a446f3dbc4a19808 attempt 1 by host operator (uid 1000) Next cursor: v1:13Events come oldest first, 50 at a time unless you pass
--limit, up to 100. Pass the printed cursor with--cursorto read the next page.
Each line has the event’s number, its time in Unix milliseconds, its kind, and then, where they apply, its operation, attempt, phase, resource, error code, message, and who caused it.
To follow a deployment’s steps in the dashboard:
- On the environment’s Deployments tab, select the deployment to expand it.
- Select Events, which lists its steps, newest first, with the same filters as the Events page. Attempts lists each time piqueld tried it, with a link to that attempt’s events.
With piquelctl, run piquelctl operation <operation-id>, which also waits
for it to finish.
Find out why something failed
The Errors page lists failures, newest first. Filter them by period, scope, event kind or error code.
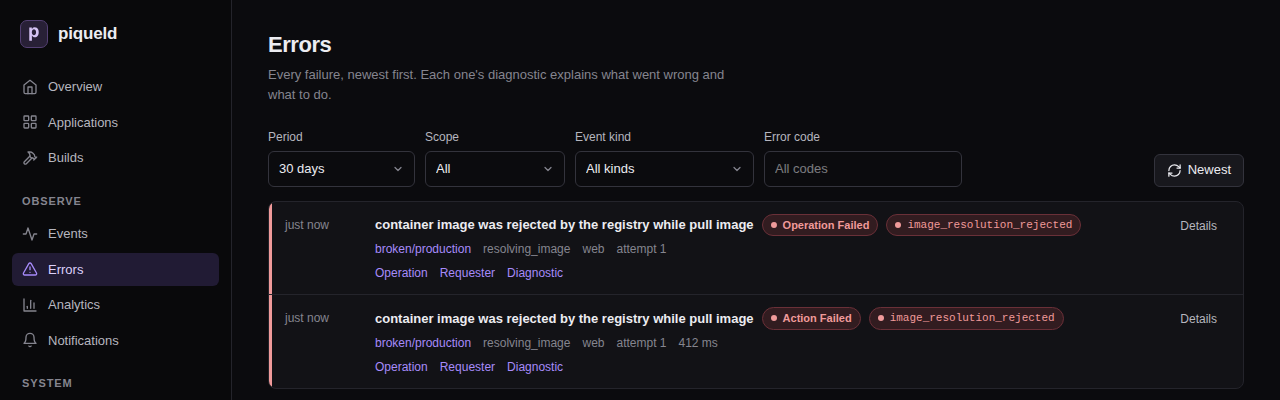
Each failure has a diagnostic. Select Diagnostic to read it:
- its heading is a stable error code, such as
image_resolution_rejected, and a summary of what went wrong; - a badge says whether it’s retryable or needs attention;
- What to do says how to fix it;
- Causes lists what led to it, such as the Docker request that failed and its HTTP status;
- Where names its environment, operation and request;
- the events of its operation follow, so you can see what happened before and after it.
Each event names its environment, and Operation lists the events of its
deployment. Details shows every field recorded with it. Requester
opens the audit trail of the session or token that started it. When a command fails, piquelctl prints the same code and
message, with a hint for what to do next.
Read logs and build output
- A service’s output: in the dashboard, it’s on the environment’s Logs
tab. With
piquelctl, runpiquelctl env logs <app> <environment>, orpiquelctl app logs <app>when the application has a single environment. These are recent lines read from Docker; for a lasting record, export them. - A build’s output: in the dashboard, see the Builds page and each
application’s Builds tab. With
piquelctl,piquelctl builds listlists recent builds, andpiquelctl builds logs <id>prints one’s output.
Watch the daemon itself
The dashboard’s Daemon status page shows:
- whether the database, the Docker engine, the Swarm manager and HTTPS ingress are ready;
- the Installation checks: whether the daemon’s public URL, its tailnet node, the Docker engine, ports 80 and 443, its secret key and its API socket are set up, each with a next step when one needs action. They run when the page opens, and again when you select Run checks;
- how many previews run against their limits, what image cleanup removed, and where telemetry is exported;
- the daemon’s uptime, memory, CPU, database size and free disk space;
- how many events and diagnostics are kept, and how much build output;
- running and queued operations, and pending and failed notifications.
These are current values. For their history, export telemetry.
With piquelctl:
piquelctl statusshows the daemon’s version, HTTPS ingress, how many previews run against their limits, what image cleanup removed, and where telemetry is exported.piquelctl doctorruns the installation checks. It exits with code 6 when one fails.piquelctl resourcesshows the daemon’s resource usage and counters.
The Host settings page shows the daemon’s
configuration as it runs, and
piquelctl settings prints it. Credentials appear only as the file they’re
read from. To change a setting, edit the configuration and restart the daemon.
These pages, doctor, resources and settings need the system:read
permission. status works for anyone signed in.
The Analytics page sums up deployments over the last 24 hours, 7, 30 or 365
days: how many succeeded or failed, how long attempts took, how often they were
retried, how long each kind of step takes, and the most common failure codes.
piquelctl analytics prints the same summary, for the last 30 days unless you
pass --since:
piquelctl analytics --since 7d
--app limits it to one application’s environment. Name the environment
with --env when the application has several.
How long history is kept
| Setting | Default | What it keeps |
|---|---|---|
retention.event_days | 90 | Application and environment events |
retention.daemon_event_days | 90 | Daemon events |
retention.audit_days | 365 | The audit trail |
retention.finished_operation_days | 10 | Finished operations other than deployments |
0 keeps everything. Deployment history is kept until its environment is
deleted. Build output has its own limits, of
size and
age.
Deleting an environment keeps its events in the application’s history. Deleting an application deletes its history.
Troubleshooting
- An event you expected is missing. You only see the applications you have
the
events:readpermission on, and daemon events needsystem:read; see permissions. It may also be older than the retention period. piquelctl eventsrejects the application. It takes the application’s ID, not its name.