Exporting telemetry
Send piqueld’s traces, metrics and logs, and the logs and resource usage of every container it runs, to an OpenTelemetry collector, so you can graph them, keep them, and alert on them.
Before you start
You need a collector that receives OTLP over gRPC, such as the OpenTelemetry Collector or Grafana Alloy, either:
- reachable from the piqueld host, which this page sets up; or
- deployed as a piqueld application, which then receives telemetry directly. The observability stack is a ready-made one.
You change the daemon’s configuration on the host. Run piquelctl there, or on
any machine where it’s signed in.
Send telemetry to a collector
-
If the collector needs a token, save it as gRPC metadata, one
name: valueper line, in a file only root can read, such as/etc/piqueld/otlp-headers:authorization: Bearer <token> -
Set the collector’s address in the daemon’s configuration. Give its port: without one, it’s 443 for
https://and 80 forhttp://, not the usual 4317. On NixOS, where the module hands the headers file to the daemon:services.piqueld.settings.telemetry = { endpoint = "https://otel.example.com:4317"; headers_file = config.age.secrets.otlp-headers.path; # optional };In
config.toml, without a token, set onlyendpoint. With one, pass the file to the service by adding to its unit’s[Service]section:LoadCredential=otlp-headers:/etc/piqueld/otlp-headersThen refer to it by that name:
[telemetry]
endpoint = "https://otel.example.com:4317"
headers_file = "otlp-headers"
The endpoint is
https://,http://, or a Unix socket such asunix:///run/otel/otlp.sock.http://isn’t encrypted: use it only on the host or a private network. The endpoint can’t contain credentials, a path or a query. -
Restart the daemon, which only reads its configuration when it starts. On NixOS,
sudo nixos-rebuild switchrestarts it. Elsewhere, reload the edited unit first:sudo systemctl daemon-reload sudo systemctl restart piqueld
piqueld also exports the output and resource usage of every container it runs.
To export only its own telemetry, set
containers = false under [telemetry], or services.piqueld.settings.telemetry.containers = false; on
NixOS.
Check that it works
The Telemetry export card on the dashboard’s Daemon status page shows where telemetry goes, whether the collector is connected, when the last export succeeded, and how many records were dropped.
With piquelctl, the Telemetry line of piquelctl status shows the same:
piquelctl status
If the collector refuses exports for a minute, piqueld records a
telemetry_export_failed diagnostic. If that lasts two minutes, it’s sent to
the daemon_failures notification category, or to
service_degradation for a receiving application. Exports never slow down deployments
or the API: when the collector can’t keep up, records are dropped.
Receive telemetry in an application
A collector deployed as a piqueld application can receive the daemon’s telemetry over a Unix socket that piqueld mounts into it, without publishing any port.
Warning: the receiving application sees the telemetry of every application, including every line their containers print, their failures, and the daemon’s own logs. Grant it only to an application whose deployers you would trust to read every application’s logs.
-
Mark the collector’s service as the one that receives telemetry. An application can have one, with one replica. In the dashboard, tick Receive telemetry on the service’s Telemetry tab, and select Save changes. With
piquelctl, runpiquelctl app service telemetry <app> collector on. In the manifest:[[spec.services]] name = "collector" receives_telemetry = true [spec.services.source] type = "image" image = "otel/opentelemetry-collector-contrib:0.163.2" -
Make the collector listen on
/run/piqueld/telemetry/otlp.sock, and use that receiver in its pipelines. This minimal configuration prints what it receives; replacedebugwith the exporters you use:receivers: otlp: protocols: grpc: endpoint: /run/piqueld/telemetry/otlp.sock transport: unix exporters: debug: service: pipelines: traces: { receivers: [otlp], exporters: [debug] } metrics: { receivers: [otlp], exporters: [debug] } logs: { receivers: [otlp], exporters: [debug] }Mount it as a file at the path your collector reads, such as
/etc/otelcol-contrib/config.yamlfor the OpenTelemetry Collector’s contrib image: on the service’s Files tab, withpiquelctl app file add, or as a file in the manifest. -
If you wrote a manifest, save it:
piquelctl app apply --file collector.toml -
Grant the environment telemetry, before deploying it, so the collector finds its socket’s directory when it starts. This needs the
telemetry:grantpermission. An account withadminon every application has it, and it can be granted on its own; no preset includes it.In the dashboard, select Grant telemetry on the environment’s Overview:
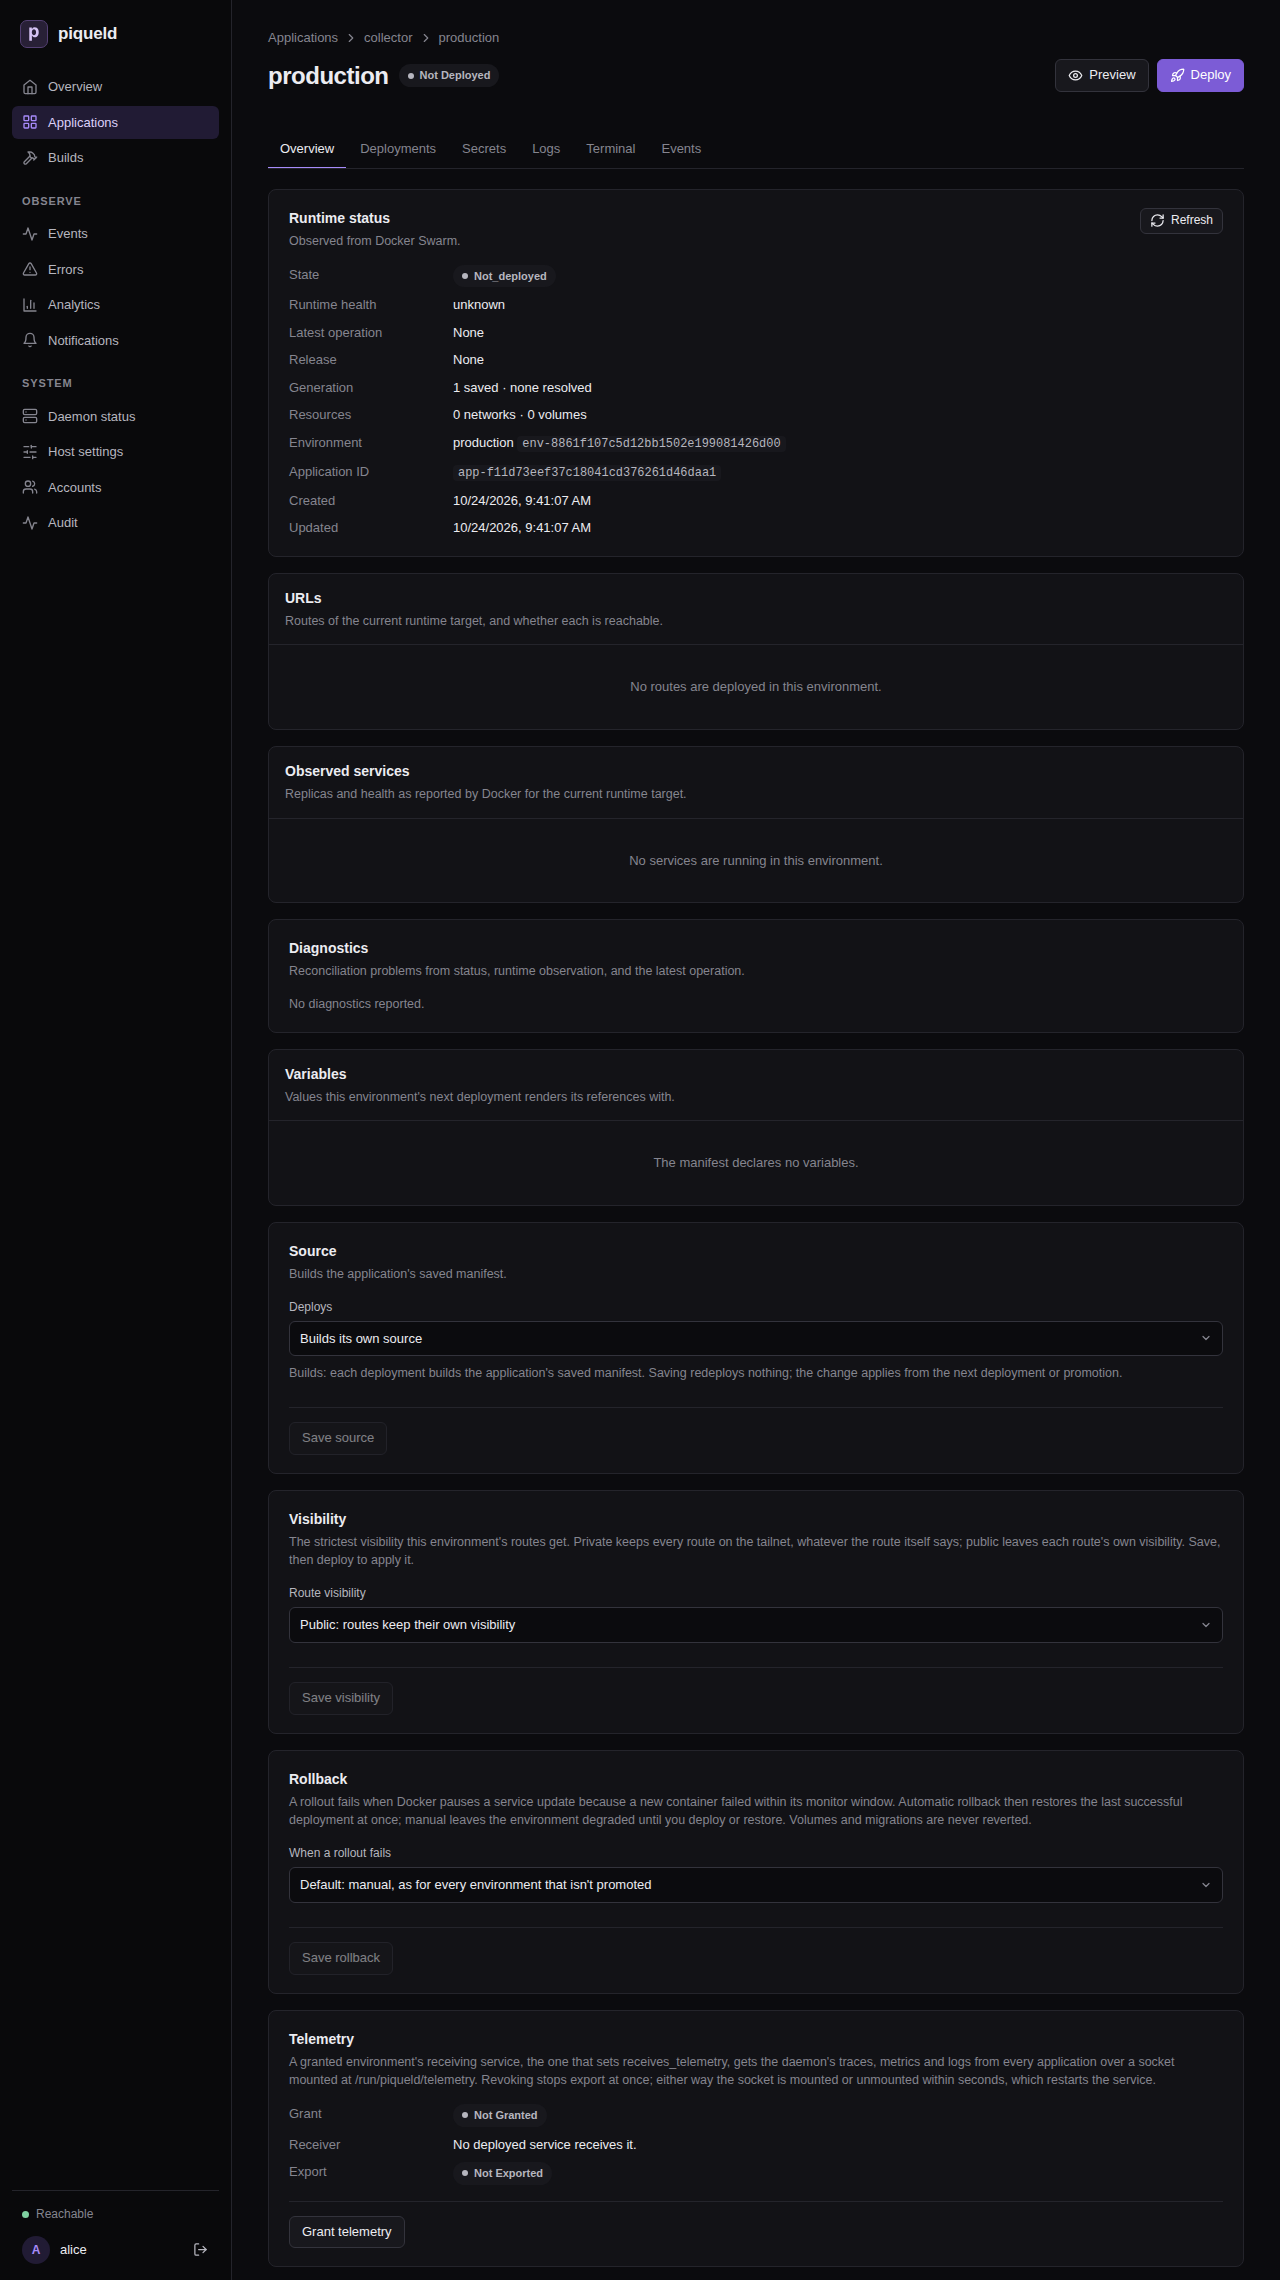
With
piquelctl:piquelctl env telemetry <app> production on -
Deploy it: select Deploy on the environment’s page, or run:
piquelctl env deploy <app> production --yes
piqueld mounts the socket’s directory into the service and starts exporting.
The environment’s Overview and piquelctl env show <app> production show
whether the daemon is connected. Revoke telemetry, or
piquelctl env telemetry <app> production off, stops it at once, and removes
the mount within seconds, which restarts the service.
Without an endpoint, the containers’ telemetry goes to granted receivers
only. A receiving service’s own output never goes back to receivers.
While granted, the receiving service runs as the daemon’s user, so that the daemon can connect to its socket. Previews are never granted telemetry.
What piqueld sends
Every record from the daemon carries service.name = piqueld,
service.version, and service.instance.id, the installation’s ID.
Traces. Each deployment and other operation is a trace, with a span for
each attempt and each step, such as building_git, run_job,
ensure_service or wait_for_service. Spans carry the application, the
environment and the failure code as error.type. API requests are spans too,
named after their method and route, such as GET /api/v1/environments/{id}.
Metrics, every 30 seconds:
| Metric | Labels | Meaning |
|---|---|---|
piqueld.deployments | application, environment, outcome | Finished deployment attempts: succeeded, failed, cancelled, superseded |
piqueld.deployment.duration | same | Their duration in seconds |
piqueld.builds, piqueld.build.duration | application, environment, outcome | Finished builds (succeeded, failed, unknown) and their duration |
piqueld.operations | state (running, queued) | Operations waiting or running |
piqueld.service.replicas | application, environment, service, state (desired, running, healthy) | Replicas of every deployed service |
http.server.request.duration | http.request.method, http.route, http.response.status_code | API latency in seconds |
piqueld.access.denials | API requests refused for a missing credential or permission | |
piqueld.database.size | file (database, wal) | The database’s size in bytes |
piqueld.notification.deliveries | state (pending, failed) | Notifications waiting or failed |
piqueld.uptime, process.memory.usage, process.cpu.time, process.cpu.utilization, piqueld.disk.available, piqueld.events, piqueld.diagnostics, piqueld.build_output.size | The rest of what the Daemon status page shows |
Prometheus translates the names, such as piqueld_deployments_total.
piqueld doesn’t serve a Prometheus scrape endpoint, but Prometheus 3 receives
OTLP itself, over HTTP with --web.enable-otlp-receiver.
Logs. The daemon’s own logs, at the level RUST_LOG selects, and every
history event. Failures are WARN, everything else INFO.
Container logs. Every line a container prints, with log.iostream set to
stdout or stderr. piqueld doesn’t guess a severity from the text. Lines
longer than 16 KiB are cut. Each container can send 200 lines a second, in
bursts of up to 2,000, and piqueld drops lines beyond that. After a restart, piqueld picks up where it
left off, as long as Docker still has the lines.
Container metrics, every 30 seconds:
| Metric | Labels | Meaning |
|---|---|---|
container.cpu.time | CPU time used, in seconds | |
container.cpu.usage | CPUs used since the previous poll; 1 is one full core | |
container.memory.usage | Memory used, page cache included, in bytes | |
container.memory.usage.limit | Its memory limit, or the host’s memory without one | |
container.network.io | network.interface.name, network.io.direction | Network bytes received and sent |
container.disk.io | disk.io.direction | Bytes read and written |
Each container’s records say which container they’re about:
| Attribute | Value |
|---|---|
service.name | The service or job name; piqueld-gateway, piqueld-tailscale or piqueld-cloudflared for piqueld’s ingress containers |
piqueld.workload | service, job, or infrastructure |
piqueld.application, piqueld.environment, piqueld.environment.id | Its environment, for services and jobs |
piqueld.preview | The preview’s slug, for previews |
container.id, container.name | The Docker container |
piqueld.task.id | The Swarm task, for services and jobs |
Troubleshooting
- Nothing arrives. Check the
Telemetryline ofpiquelctl status. If it says the collector is failing, check that the host can reach the endpoint, and the token in the headers file. - The receiving collector keeps restarting. Its environment probably isn’t
granted telemetry, so the socket’s directory is missing. Deploying it warns
with
telemetry_not_grantedin that case. - Records are dropped. The collector is too slow or unreachable. piqueld never waits for it, so it drops what it can’t send.